Technical Skills Demonstrated
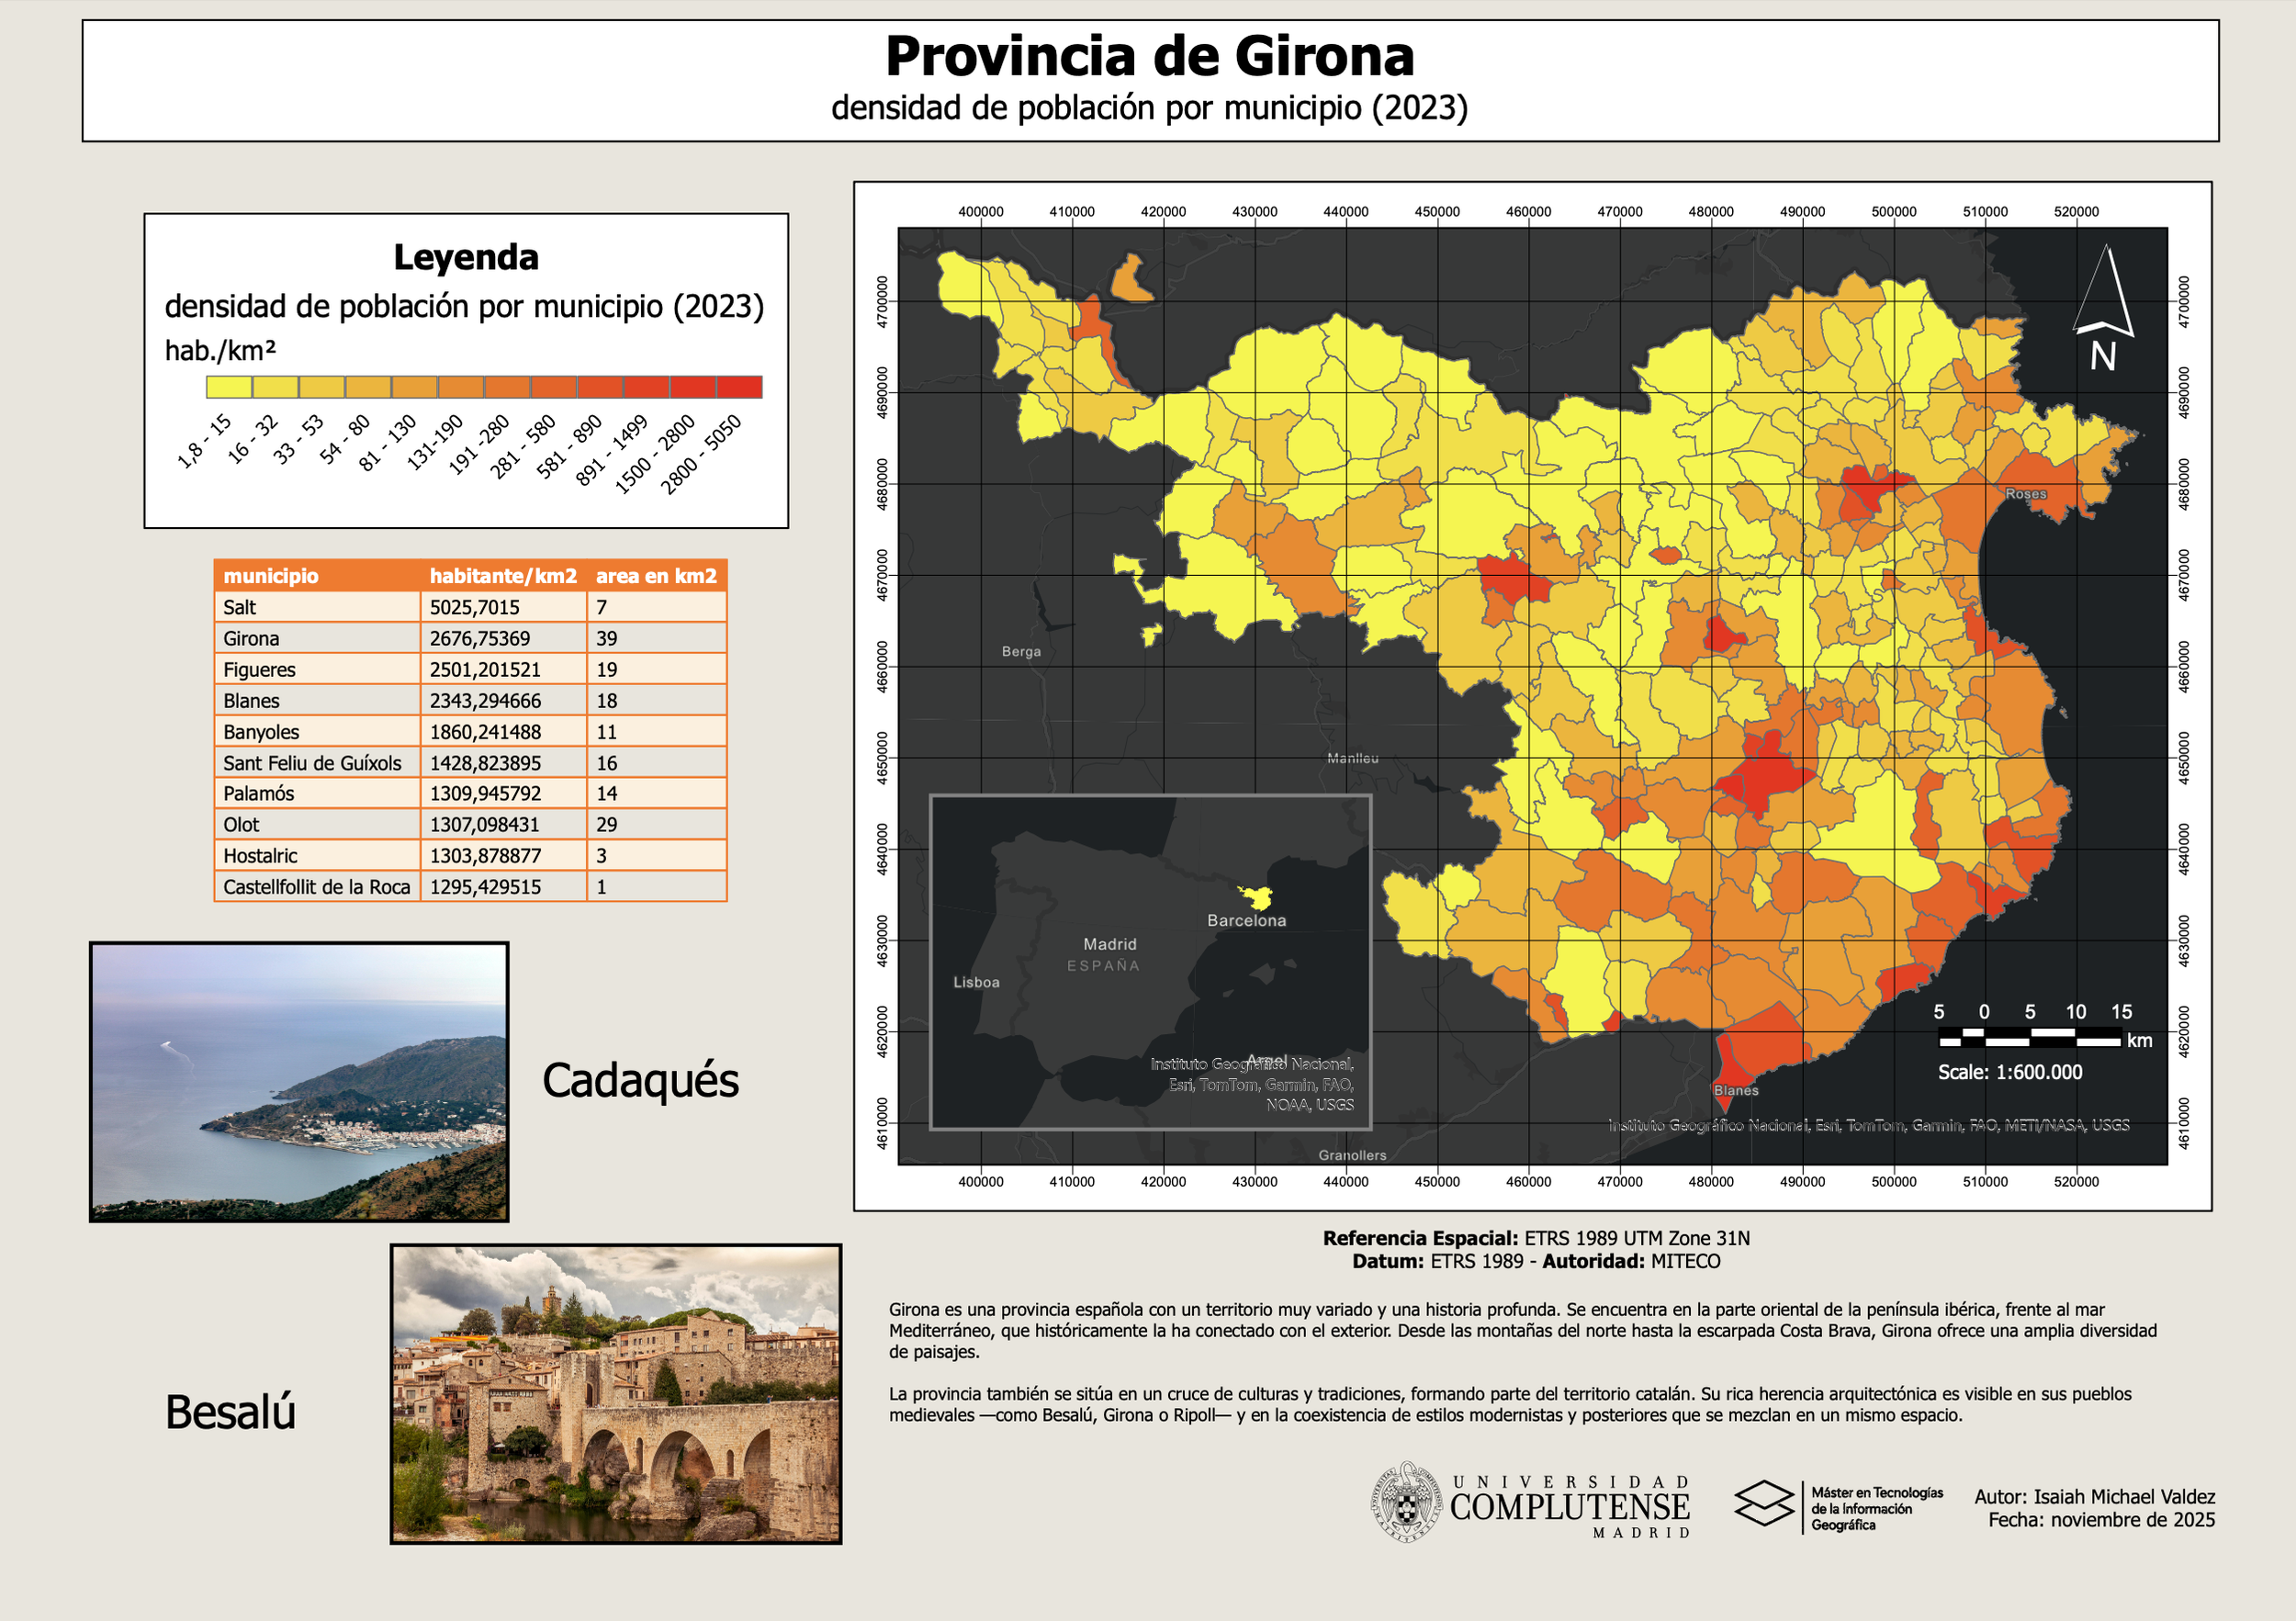
Generated a choropleth map of population density by joining municipal demographic data to spatial polygons.
Styled the map using graduated color symbology to represent density ranges clearly and effectively.
Applied label placement, map frames, scale bars, north arrows, and a legend to produce a cartographically complete map layout.
Inserted inset maps to provide geographic context within Spain and highlight the province’s position.
Created supporting tables and integrated external images to enhance narrative and visual interest.
Configured map projections (ETRS89 / UTM Zone 31N) and ensured consistent coordinate system usage across layers.
Designed a full map layout with titles, descriptive text, and attribution following cartographic standards.